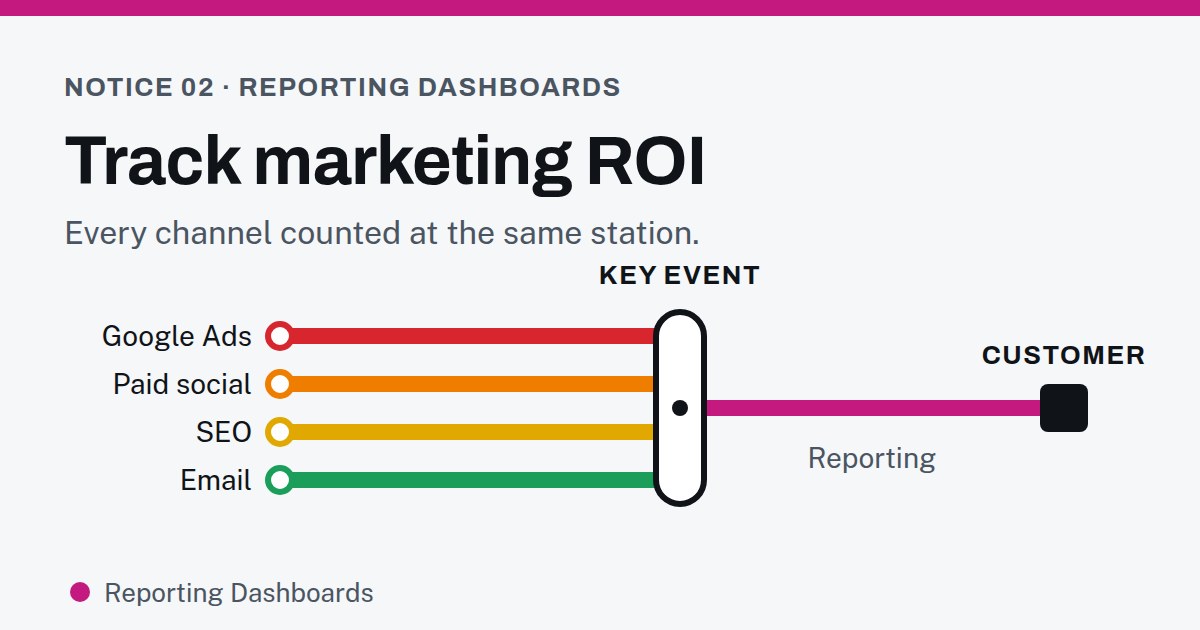
Marketing ROI is hard to track, even for big teams
If you struggle to say what your marketing returns, you’re in good company. In a 2022 Gartner survey of 377 people who use marketing analytics, analytics influenced just 53% of marketing decisions. The top reasons given weren’t a lack of tools. They were that “data are inconsistent across sources” and “data are difficult to access.”
Those are large companies with analysts on staff. A small business has the same problem with fewer people: the ad platform says one thing, the email tool another, analytics a third, and the only number everyone trusts is the bank balance. The fix is to decide what counts, then count it the same way everywhere.
Tracking marketing ROI with key events: decide what counts first
Google Analytics calls the actions that matter to your business key events: “an event that measures an action that’s particularly important to the success of your business.” Start with three or four: a contact form sent, a call from the website, a booking made, a purchase.
That list is the whole foundation. When the same key events feed Google Analytics and, as conversions, Google Ads, every channel is finally being measured at the same station.
Marketing ROI tracking with UTM links: label every campaign
Analytics can tell a Google search from a Facebook visit on its own. It can’t tell your October newsletter from your September one, or the link in your email signature from the link on a flyer — unless you label them. That’s what UTM parameters are for: short tags added to a link so Analytics knows which campaign sent the visit.
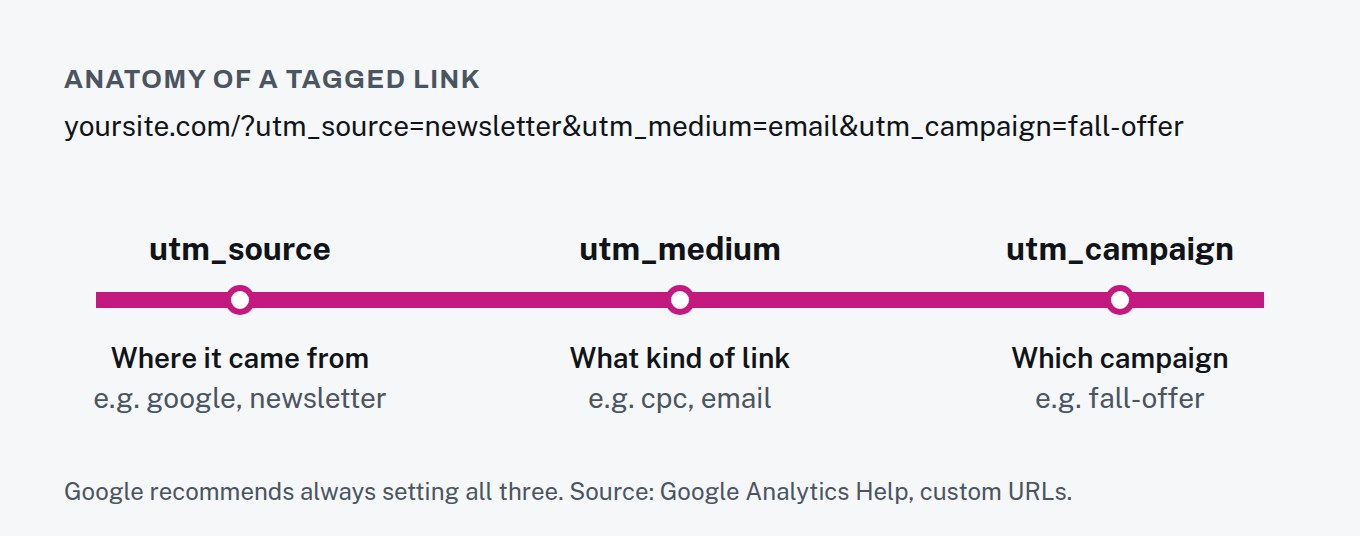
Google’s guidance is to always set utm_source, utm_medium and utm_campaign. Pick a naming scheme once — lowercase, hyphens, the same spelling every time — and write it down, because “Newsletter” and “newsletter” show up as two different sources.
Tracking ROI from phone calls: the leads analytics can’t see
If the phone brings in more of your work than the contact form, this matters. A call made from a phone number on your website leaves no trace in a standard analytics setup. Google Ads can measure calls directly from your ads, calls to a number on your website, and taps on a phone number on your mobile site — but only if it’s set up to.
The same page describes offline conversion imports: uploading sales that closed later, so a lead that became a customer three weeks after the click still gets credited to the campaign that produced it. That’s the difference between counting inquiries and counting customers.
Lead source tracking: matching leads to customers in your CRM
Analytics counts visits and key events. It can’t tell you who became a customer, because that usually happens later: on a call, in person, or on an invoice. The link between the two is your CRM, and it only works if every lead arrives with its source attached.
In practice that means three things:
- Forms carry the campaign with them. Hidden fields on your contact form can capture the UTM tags from the page URL, so the CRM records “fall-offer newsletter,” not just “website.”
- Calls are labeled too. A separate tracking number per channel — one on the website, one in ads, one on printed material — tells you where a phone lead came from without asking.
- Someone marks the outcome. When a lead becomes a customer, the CRM record changes stage. Without that step, the report can count inquiries but never customers.
It’s worth asking every new customer how they found you as well. Their answer won’t always match the data, and the disagreements are useful: a customer who “saw you on Google” but arrived through a tagged newsletter link tells you both channels did some of the work.
Once leads and customers carry their source, the monthly question becomes simple to answer: of the customers we won, where did each one start?
Marketing attribution: why every tool claims the same sale
A customer might see a social ad on Monday, search your name on Thursday, and book after an email on Saturday. Each platform reports the conversions it can see from its own side of that journey, so adding their totals together can count the same customer more than once.
Google has narrowed its own options. In Google Ads, the first-click, linear, time-decay and position-based models are no longer supported. What’s left is last click, which gives all the credit to the final ad clicked, and data-driven, which “uses your account’s data to calculate the actual contribution of each interaction.” Neither can see your other channels. That’s why the report has to sit above the platforms, not inside any one of them.
Marketing ROI report: five numbers per channel
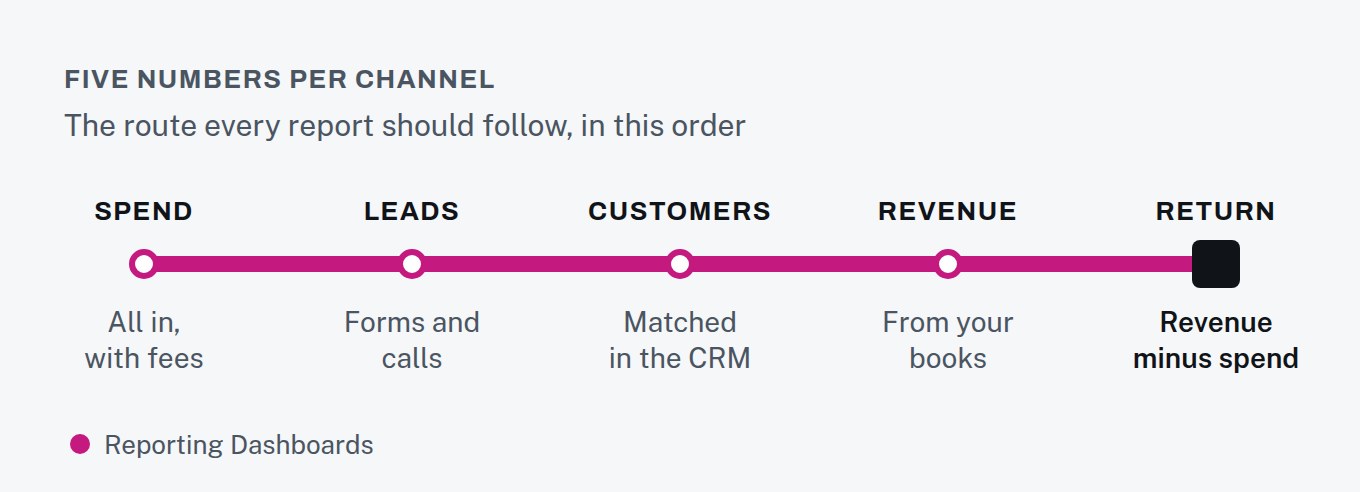
For each channel, every month: what you spent (fees included), how many leads came in, how many became customers, what they paid, and the difference. Five numbers, in that order, for every channel you run. Where a number is estimated rather than measured — attribution usually is — the report should say so.
Track marketing ROI: where to start
Write down your three or four key events and mark them in Google Analytics. Tag the next campaign link you send. Make sure calls from your website are being counted somewhere. Then build the five-number report, even if it starts as a spreadsheet.
When it outgrows the spreadsheet, that’s our Reporting Dashboards line: one live report with every channel in it, answering the same five questions every month.